


 67 Monroe Avenue, Pittsford, NY 14534 / 9am - 4pm M-F


By Joseph Zappia, Co-Chief Investment Officer
When the S&P 500 is trading at a meaningful drawdown from its all-time high, what do forward returns look like? We studied every month-end close since January 1950 where the index sat 10%, 20%, or 30%+ below its prior peak, then measured the subsequent 1-year, 5-year, and 10-year price returns. The results make a compelling case for disciplined buying during periods of broad market stress.
Key Findings
The deeper the drawdown at the point of entry, the better the forward returns — and the higher the probability of a positive outcome. At 30%+ drawdowns, the 1-year win rate is 97.4% with an average return of +20.6%. Over 10 years, the record is 38 for 38 — a perfect 100% win rate — with a worst-case cumulative return of +30.5%.
The 5-year horizon tells the most actionable story for portfolio construction. Entry at 30%+ drawdowns delivered an average annualized return of 10.7% with only one observation producing a loss (−6.7% cumulative). Compare that to entry at 10–20% drawdowns: a lower 81% win rate and only 6.3% annualized.
Visual Summary
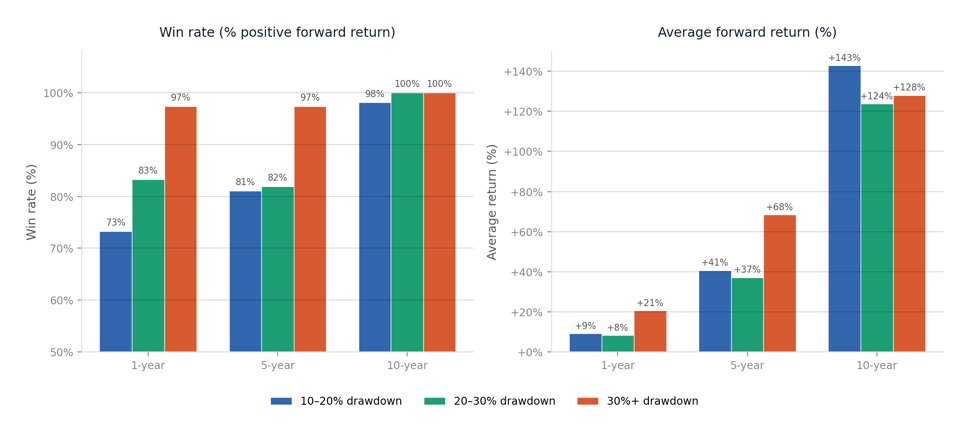
Source: S&P 500 monthly closes, Jan 1950 – Mar 2026. Price return only (excludes dividends).
Complete Data
Forward returns by drawdown bucket:
| Drawdown | n | 1Y Win | 1Y Avg | 5Y Win | 5Y Avg | 5Y Ann. | 10Y Win | 10Y Avg | 10Y Ann. |
|---|---|---|---|---|---|---|---|---|---|
| 10 – 20% | 172 | 73.3% | +9.2% | 81.1% | +40.7% | +6.3% | 98.1% | +142.8% | +8.5% |
| 20 – 30% | 84 | 83.3% | +8.3% | 81.9% | +37.2% | +5.9% | 100% | +123.8% | +7.7% |
| 30%+ | 38 | 97.4% | +20.6% | 97.4% | +68.5% | +10.7% | 100% | +128.0% | +8.2% |
Range of outcomes (best and worst observations):
| Drawdown | 1Y Best | 1Y Worst | 5Y Best | 5Y Worst | 10Y Best | 10Y Worst |
|---|---|---|---|---|---|---|
| 10 – 20% | +52.7% | −42.5% | +200.3% | −27.9% | +365.4% | −6.7% |
| 20 – 30% | +33.6% | −26.6% | +93.9% | −32.6% | +332.8% | +0.6% |
| 30%+ | +52.2% | −2.6% | +146.1% | −6.7% | +270.3% | +30.5% |
Episode Context
The 30%+ drawdown observations cluster in just three episodes: the 1973–74 bear market (8 months), the 2001–03 dot-com bust (17 months), and the 2008–09 Global Financial Crisis (13 months). This concentration matters. It means the sample, while consistent in outcome, reflects only three distinct macro regimes. A prolonged secular drawdown of the kind seen in Japan post-1990 has not occurred in the U.S. post-war data set.
That said, all three episodes involved fundamentally different catalysts — stagflation, speculative excess, and a credit crisis — yet produced remarkably similar forward return profiles. The consistency across varied macro environments is itself a signal worth noting.
Methodology & Caveats
Data: S&P 500 month-end closing prices from January 1950 through March 2026. Drawdown is calculated as the percentage decline from the most recent all-time high monthly close. Forward returns are measured from the drawdown month-end to the corresponding month-end 1, 5, or 10 years later.
Price return only. These figures exclude dividends. Including reinvested dividends would improve all return figures by approximately 2–3% annualized, making the actual total return profile even more favorable.
Win rate is defined as the percentage of observations that produced a positive forward return over the stated horizon. Average return is the arithmetic mean of all observations in each bucket.
The Bottom Line
Since 1950, buying the S&P 500 at a 30%+ drawdown from all-time highs has produced a positive return 97% of the time over the following year, with an average gain of +20.6%. Over five years the win rate remains 97%, with an average cumulative return of +68.5% (10.7% annualized). Over ten years, the record is 100% — 38 for 38 — with a worst case of +30.5%.
The deeper the drawdown, the stronger the forward signal. Patience and discipline at moments of maximum discomfort have been the single most reliable source of long-term equity returns in the post-war era.
Disclosure: This information is provided by LVW Advisors for general information and educational purposes based upon publicly available information from sources believed to be reliable. LVW Advisors cannot assure the accuracy or completeness of these materials. The analysis shown is based on historical S&P 500 Index price returns from January 1950 through March 2026 and is for illustrative purposes only. Results are based on a limited number of historical periods and may not reflect future market conditions. Past performance is not indicative of future results. Returns shown exclude dividends, transaction costs, fees, and taxes, which would impact actual results. This analysis does not represent the performance of any specific portfolio or strategy and should not be construed as investment advice or a recommendation to buy or sell any security. Investors should review applicable offering documents and consider their individual circumstances before making investment decisions. All investments involve risk, including the possible loss of principal. LVW Advisors is a registered investment adviser.