67 Monroe Avenue, Pittsford, NY 14534 / 9am - 4pm M-F


By Joe Zappia, Principal and Co-Chief Investment Officer
Co-authored by Nicholas Zappia, Marshall School of Business, University of Southern California, Class of 2023
Warren Buffett, in his 2008 letter to the shareholders of Berkshire Hathaway, wrote:
Long ago, Ben Graham taught me that ‘Price is what you pay; value is what you get.’ Whether we’re talking about socks or stocks, I like buying quality merchandise when it is marked down.”
— Warren Buffett
Both price and value are the two sides of the same coin. Understanding the difference between price and value is one of the core principals of investing. Put another way, there can be a stark discrepancy between a great company and a great stock – with a singular determinant – price. Since the beginning of time, there are numerous examples of the price of an asset being severely disconnected from the underlying value of the asset itself: the Dutch tulip bulb mania in 1637, the dot-com bubble in 1999, the housing bubble in 2008, and bitcoin in 2017.
But what if a disconnect is not so obvious?
There have been many comparisons of the current stock market conditions to those of the early 1970s. Each had a precipitous fall into a quick recession; the 1970s were marked by the Yom Kippur Wars and the Oil Crisis, and today by the Covid-19 pandemic. Another notable similarity is the presence of a group of stocks that, due to their high-growth potential, are continuously purchased. These “one rule” (the one rule is “buy”) stocks were colloquially known as the Nifty-Fifty throughout the 1960s and 1970s. The Nifty-Fifty contained companies that were consistently considered “buys” due to their extreme growth potential, regardless of their high valuations. And grow they did. Modern juggernauts like McDonald’s (MCD), Coca-Cola (KO), and Johnson and Johnson (JNJ) were members of the Nifty-Fifty, and they saw earnings growth in the hundreds of percent from the early 1970s through the 1980s. So, can select stocks really be growing fast enough to always be considered a buy? Yes and no.
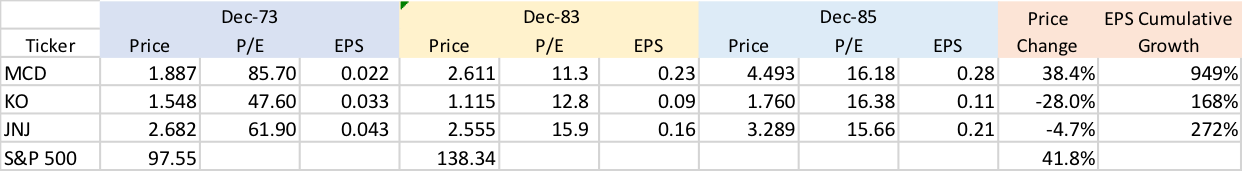
If an investor decided on December 28, 1972 to purchase $1,000 of each McDonald’s, Coca-Cola, and Johnson and Johnson, in ten years, what level of return on their investment would have been achieved? While all three companies had earnings growth over the ’73-’83 period of more than 150%, shockingly, their 10-year return at the end of 1982 would have been only +38.4%, -28%, and -4.7%, respectively. For the same period, the S&P 500 returned 37.9%.
At the end of 1972, all three P/E ratios exceeded 45, with McDonald’s at a towering 85.7. So despite choosing the hottest one-rule companies with massive P/Es and huge growth potential, the return would be negligible due to the sub-optimal entry point. On the other hand, if held for a longer period of time, these companies would have yielded a significant return, but this return would have been greatly neutered by the near-peak entry. Yes, if held just two additional years until December 1985, their cumulative return would have been 72%, 58%, and 29% for MCD, KO, and JNJ respectively, and if held 15-20 years, the gain would be massive. However, how many investors have the discipline and foresight to stick with a 20-year pick when the first ten are in the red?
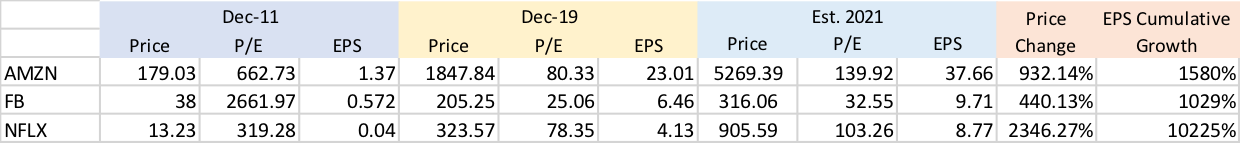
Today, many are drawing a parallel between the Nifty-Six, some of the largest companies in the world—Amazon, Apple, Microsoft, Alphabet (Google), Netflix, and Facebook— and the Nifty-Fifty in 1973. These companies are growing their revenue and earnings at an electric pace, and their stock price is following suit. For example, from 2012 to today, Amazon’s earnings have grown from $1.37/share to $23/share (over a 1500% increase), yet its share price over the same time period increased by only 932%, suggesting Amazon’s price has failed to keep up with its earnings growth. Could Amazon truly be a one-rule stock due to this price lag? Will Amazon see a decade of high returns, or trail the market as Johnson & Johnson and Coca Cola did in the 1970s? With 2021 estimates continuing to project meteoric earnings growth, these companies’ prices may be justified. Considering current and projected earnings, each of these companies could be regarded as a good value for the price, despite high P/E multiples. For example, between 2012 and 2019, Netflix’s price cumulatively grew 2346%, but their earnings grew over 10,000% in the same period. Netflix’s price still has a lot of growth potential to match their earnings growth. As the eventual return of the Nifty-Fifty stocks displayed, value is value, and in the long run, the price appropriately reflected it. However, they also displayed the importance of timing in your entry. Price is what you pay for the company’s value, and when prices are high, you get less value per dollar. When a company is priced for perfection, it leaves little margin for error.
Shown in today’s Nifty-Six, the market tends to favor certain companies during bull markets. The next most recent example is the dot-com bubble in 1999.
If an investor purchased shares of Intel at the peak of 1999, it would still be in negative territory today (excluding dividends), despite Intel growing its earnings and revenues by 280% and 124% cumulatively from ’99 to today. Another great example is Microsoft. Shares purchased at the peak in 1999 didn’t retake that price until late 2016, yet their earnings and revenue grew 640% and 362% cumulatively in the same period. Great companies are only great investments at the right price.
The takeaway from this: price does not always reflect value. Coca-Cola in ‘73, Intel in ‘99, and Amazon today are all great companies, but before making a decision to invest, you must analyze if the current price reflects fair value, an overly optimistic future value, or is trading at a discount to expected future value. As stated earlier, price and value are not the same. If you overpay, even for a great company, making a good return may be difficult.
Sources:
https://www.seeitmarket.com/comparing-todays-stock-market-with-the-1970s/
https://theirrelevantinvestor.com/2018/11/26/the-nifty-fifty/
https://ycharts.com/charts/fundamental_chart/
https://www.deseret.com/1990/1/28/18843715/80s-were-a-golden-decade-for-mcdonald-s-br-company-posts-earnings-of-727-million-for-1989
https://mailchi.mp/verdadcap/the-bubble-500?e=e1bc46b3d3
The opinions expressed here are that of the author and may not reflect the opinions of LVW Advisors. This information is provided by LVW Advisors for general information and educational purposes based upon publicly available information from sources believed to be reliable – LVW Advisors cannot assure the accuracy or completeness of these materials. The information presented here is not specific to any individual’s personal circumstances. To the extent that this material concerns tax matters, it is not intended or written to be used, and cannot be used, by a taxpayer for the purpose of avoiding penalties that may be imposed by law. Each taxpayer should seek independent advice from a tax professional based on his or her individual circumstances. The information in these materials may change at any time and without notice. Past performance is not a guarantee of future returns.