


 67 Monroe Avenue, Pittsford, NY 14534 / 9am - 4pm M-F



By Joseph Zappia, Co-Chief Investment Officer
Building wealth in public equities is simple: own a diversified slice of American business, reinvest what it pays, and give it time. Most investors who can recite that formula still fail to capture it, and that failure is rarely analytical. Two things stand between an investor and long-term wealth compounding: the stories we are told, and how we are built to react to them. For families managing significant wealth, those reactions often affect far more than a portfolio; they can influence retirement plans, tax decisions, charitable goals, and the legacy a family hopes to leave behind.
A word on why now. By the cyclically adjusted Shiller P/E measure, this is the most expensive US stock market since the dot-com era; public datasets that track Robert Shiller’s CAPE series show readings around 40x in mid-2026. At the same time, sentiment is sour. A strange combination, since expensive markets usually arrive with euphoria, not anxiety. The combination of a high starting valuation and anxious investors is precisely the condition under which the temptation to do something is strongest, which makes it the right moment for this reminder.
The challenge isn’t knowing what to do; it’s having the discipline to stay the course when uncertainty is highest.
Long-term returns come with tuition: you pay it by sitting through volatility, and by accepting that from a starting point this expensive, returns over the next several years may be poor before they are good. Stretch the lens from months out to twenty years, and the picture changes.
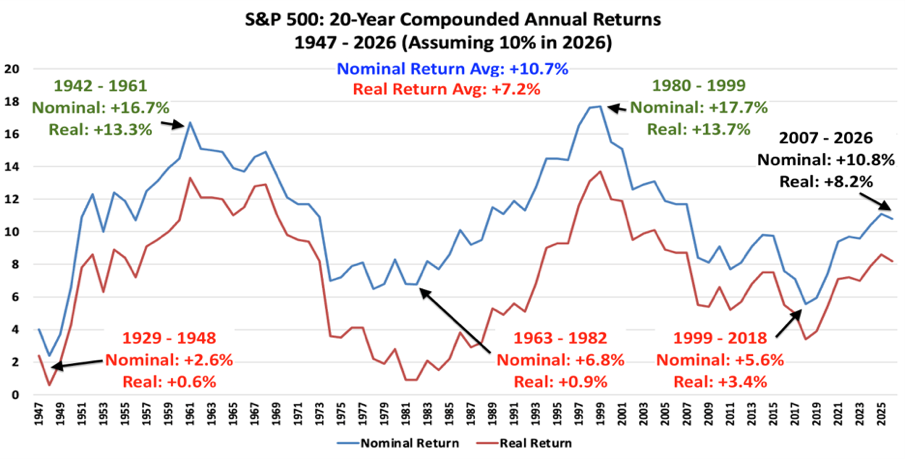
S&P 500 rolling 20-year compounded annual total returns, nominal and real, 1947–2026. Returns are calculated from annual S&P 500 total return data and inflation data. The final point assumes a 10 percent total return for full-year 2026. Source: NYU Stern / Damodaran historical dataset.
The Long View
Rolling twenty-year annualized returns of the S&P 500 (see above) have averaged roughly 10.7 percent nominal and 7.2 percent real since the late 1940s. That double-digit headline is reassuring and, on its own, misleading. Returns over periods this long vary enormously around the average.
The best stretches ran hot: holding from 1942 to 1961, or from 1980 to 1999, produced high-teens nominal returns and the low-teens real returns. The worst stretches were grim. From 1929 to 1948 an investor earned about 2.6 percent nominal and barely positive after inflation. From 1963 to 1982, nominal returns were a soft 6.8 percent and real returns rounded to nothing. From 1999 to 2018, annualized returns were approximately 5.6 percent nominal and 3.4 percent real.
In this historical record, every one of those difficult twenty-year windows still produced a positive nominal return. The investors who held through the Depression and the war, through stagflation and two oil shocks, through the dot-com bust and the Global Financial Crisis, came out the other side ahead in nominal terms. In the US data, twenty years has been roughly the minimum holding period at which nominal losses disappear. Yes, eighty years of rolling windows contain only a handful of truly independent twenty-year stretches, and the sample is thinner than the chart makes it look. But the historical floor is not a statistical accident waiting on a larger sample. Over two decades, reinvested dividends and nominal earnings growth have often compounded into a cushion large enough to absorb even a severe repricing. For long-term investors, the lesson is less about predicting outcomes and more about aligning expectations. The path matters because the ability to remain invested is often what determines whether the long-term outcome is ever realized.
Narratives and Nerves
Look at what those bad stretches contained. The 1929 window opened with a crash and ran straight into the Depression and a world war. The 1963 window was inflation grinding higher, rates following, and two recessions in under a decade. The 1999 window began with a bubble bursting and went on to deliver a recession, September 11, a war, and the worst financial crisis since the 1930s.
In real time, each window was a continuous, well-argued case for selling. The headlines were not wrong about the events; they were wrong about what to do in response. The leap from “this is bad” to “therefore sell” is what destroys long-run returns. That distinction is particularly important when investment decisions are connected to broader family objectives. A reaction made in the heat of a difficult market can affect plans that extend well beyond the market itself.
The most recent twenty-year window, 2007 through 2026, compounded at about 10.8 percent nominal and 8.2 percent real. Sitting inside that period is 2008, when the S&P 500 Index fell 36.6 percent. The investors who earned the full twenty-year number are, by definition, the ones who did not sell in the spring of 2009. That is the hard part, and it is hard for a reason. A drawdown does not feel like a temporary dip in a long series. It feels like the floor giving way. We are wired to treat a 30 percent paper loss as a threat to survival, and survival instincts do not wait twenty years for vindication. The value of a well-constructed plan is that it exists before those instincts arrive.
The Price You Pay
None of this makes the entry point irrelevant. Shiller CAPE data show that the strong stretches began cheap, with the cyclically adjusted P/E near 10x in both 1942 and 1980. The weak ones began expensive: roughly 27x in 1929, around 40x at the 1999 peak, depending on the month measured. Valuation is a poor timing tool over months. Over decades it behaves like gravity.
As of mid-2026, the Shiller P/E sits near 40x, closer to the 1999 setup than to the starting points that preceded the strongest long-run stretches. That is not a tailwind. Two honest qualifications follow from it. First, the historical floor is a fact about the US market, one of the best-performing equity markets of the past century; Japan is the cautionary counterexample. The Nikkei 225 peaked at 38,915.87 on December 29, 1989 and did not exceed that level again until February 2024, a nominal price-index recovery of roughly 34 years. Second, even within the US record, starting this expensive has meant landing near the low end of the range: 1999’s window delivered about 3.4 percent real, not the 7.2 percent average. What a long horizon buys are not rich returns, but a narrower range of outcomes with a floor that has, so far, stayed above zero. Starting expensive argues for sober expectations about where in that range you may land. It also argues for separating expectations from emotions. Markets may not cooperate with our preferred timeline, but financial plans should not depend on short-term market cooperation to succeed.
The Playbook
Knowing the floor exists is not the same as having a plan for the drops on the way to it. In practice, successful wealth management is less about predicting downturns than preparing for them.
Corrections and bear markets are not interruptions of the process; they are part of the process. The 1929, 1973, 2000, and 2008 declines sit inside the same series that produced every positive twenty-year return above. A high starting valuation does not predict the timing of the next decline, but it does make the margin for disappointment thinner.
So why does the playbook not change when valuations are this high? Because the alternative requires being right twice: selling near the high and buying back lower is the trade everyone imagines making, and it demands two correct calls executed against your own instincts both times. The moment that feels safest to re-enter almost never arrives at the bottom, and peak anxiety almost never arrives at the top. Miss either call, and an investor can underperform the simpler choice of staying invested. A high starting valuation lowers the expected destination but does not make the exits any easier to time.
For an investor with a long horizon and cash yet to deploy, a rules-based plan for adding during weakness has historically improved the odds of buying at better prices than waiting for markets to feel comfortable again. The precise result depends on the market, time horizon, and rebalancing rule, so the point is not that every dip should be bought indiscriminately. The declines that feel hardest to buy are often the moments when discipline matters most.
Stay invested. Add into weakness on a plan, not a feeling.
The objective is not to predict every market move. It is to ensure that investment decisions remain aligned with the broader goals they are intended to support.
The Uncomfortable Corollary
Hendrik Bessembinder’s research reframes the entire exercise. In “Do Stocks Outperform Treasury Bills?” he examined US common stocks in the CRSP database since 1926 and found that the best-performing 4 percent of listed companies accounted for all of the market’s net wealth creation of the US stock market above one-month Treasury bills, while the remaining 96 percent collectively matched Treasury bills.
The instinct is to go hunt for those 4 percent. The more practical response is nearly the opposite. The challenge is not identifying tomorrow’s winners; it is building a strategy robust enough to succeed without needing to.
Those companies are identifiable only in hindsight, and the market’s returns are not spread evenly through time; they concentrate in stretches no one reliably calls in advance. Broad ownership held for a long time is one way to make sure you own the few stocks that matter on the days they do their work. Trading in and out on the narrative of the moment is the most reliable way to be somewhere else when it happens.
The Job
Compounding is simple. It is hard because the plan asks you to do nothing while the world hands you a steady, intelligent, well-sourced case for doing something.
For families, the challenge is rarely a lack of information. It is the ability to make thoughtful decisions when uncertainty is high and emotions are strongest. For the attorneys, accountants, and other trusted professionals who serve those families, the challenge is often the same.
The edge is not a better forecast; it is the temperament to remain committed to a well-constructed plan when doing so feels irresponsible.
That is the real job.
Sources:
Robert Shiller/Yale data on the cyclically adjusted price-to-earnings ratio (CAPE), including historical valuation levels and inflation data; mid-2026 readings cross-checked against public CAPE trackers that draw on Shiller’s dataset.
Public investor-sentiment measures such as the AAII Investor Sentiment Survey and other sentiment trackers used to characterize the mid-2026 sentiment backdrop as uneven rather than euphoric.
NYU Stern / Aswath Damodaran historical returns dataset for annual S&P 500 total returns, with real-return figures calculated using CPI-based inflation adjustments. The 2026 data point is illustrative and assumes a 10 percent total return for full-year 2026.
S&P 500 calendar-year total return data showing a roughly -37 percent total return for 2008, consistent with commonly cited annual total return tables.
Nikkei 225 historical price-index data showing a peak of 38,915.87 on December 29, 1989 and a first move above that level in February 2024.
Hendrik Bessembinder, “Do Stocks Outperform Treasury Bills?” Journal of Financial Economics, 2018; research based on CRSP common stock data from 1926 onward.
Disclosure: This information is provided by LVW Advisors for general information and educational purposes based upon publicly available information from sources believed to be reliable. LVW Advisors cannot assure the accuracy or completeness of these materials. Results are based on a limited number of historical periods and may not reflect future market conditions. Past performance is not indicative of future results. Returns shown exclude dividends, transaction costs, fees, and taxes, which would impact actual results. This analysis does not represent the performance of any specific portfolio or strategy and should not be construed as investment advice or a recommendation to buy or sell any security. Investors should review applicable offering documents and consider their individual circumstances before making investment decisions. All investments involve risk, including the possible loss of principal. LVW Advisors is a registered investment adviser.